In the first three parts of this series, we emphasized the significance of cleaning time series data and provided various techniques for handling missing data, dealing with duplicate values, and removing anomalies or outliers. In this final instalment, we will delve into data smoothing, which is a critical step in the analysis of time series data.
Data Smoothing
Data smoothing is a technique used to remove noise from time series data, making it easier to analyze and interpret. There are several methods of data smoothing, such as moving averages, exponential smoothing, resampling, and spline interpolation. However, it’s important to note that not all time series data requires smoothing. The need for smoothing depends on the analysis or model that you intend to use. In some cases, heavily preprocessed data, like the present example, may not require additional smoothing. It’s always essential to assess your data and consider the specific context to determine if smoothing is necessary.
Stay up-to-date with our latest articles!
Subscribe to our free newsletter by entering your email address below.
Moving averages
Moving averages involve calculating the average of a fixed number of consecutive data points, such as the previous three or five points. This can help to remove short-term fluctuations in the data and reveal longer-term trends.
# Calculate a rolling mean with a window of 3
df_smoothed = df_beer['Production'].rolling(window=3).mean().dropna()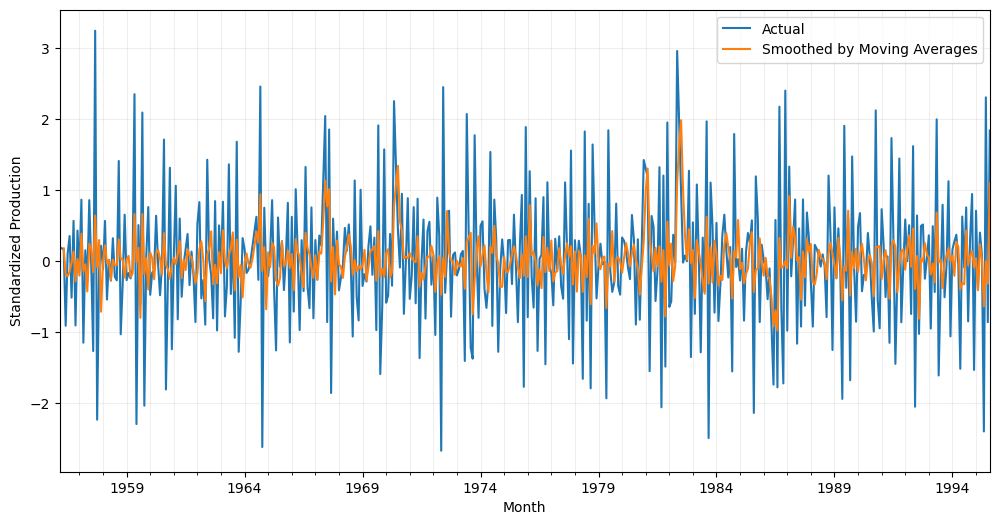
Exponential smoothing
Exponential smoothing is a data smoothing technique that uses a weighted average of past observations to generate a smoothed value for the current observation. The weights assigned to each past observation decrease exponentially over time, with more recent observations being given greater weight than older ones.
Exponential smoothing is a widely used and effective technique for removing noise and identifying trends in time series data. It can be applied to various types of time series, including those with a trend, seasonality, or both.
One of the key advantages of exponential smoothing is its simplicity and ease of use. It requires minimal parameter tuning, making it a straightforward and accessible technique for data analysts and practitioners. Additionally, exponential smoothing can be easily adapted to incorporate additional information, such as seasonal effects or external factors, using more complex models such as Holt-Winters exponential smoothing.
# Calculate exponential smoothing with a smoothing factor of 0.7
df_smoothed = df_beer['Production'].ewm(alpha=0.7).mean()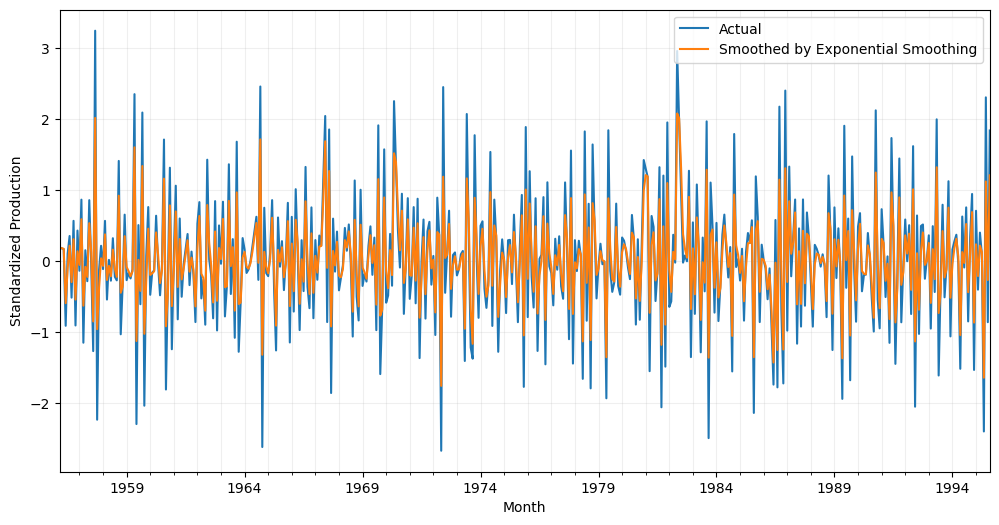
Resampling
Resampling is a data smoothing technique that involves changing the frequency of a time series data by aggregating or disaggregating data points. In other words, it involves converting a time series from one frequency to another, such as from daily data to monthly data or vice versa.
Aggregating data involves grouping observations within a given time period and summarizing them using a statistical measure such as the mean or median. Disaggregating data, on the other hand, involves increasing the frequency of the data by interpolating values between existing observations.
Resampling can be useful for smoothing time series data as it can reduce the impact of short-term fluctuations, highlight longer-term trends, and make it easier to visualize the data over different time horizons. However, it’s important to note that resampling can also introduce bias or distortions in the data, depending on the specific resampling method used and the properties of the original data.
# Resample data bimonthly
df_smoothed = df_beer['Production'].resample('2M').mean()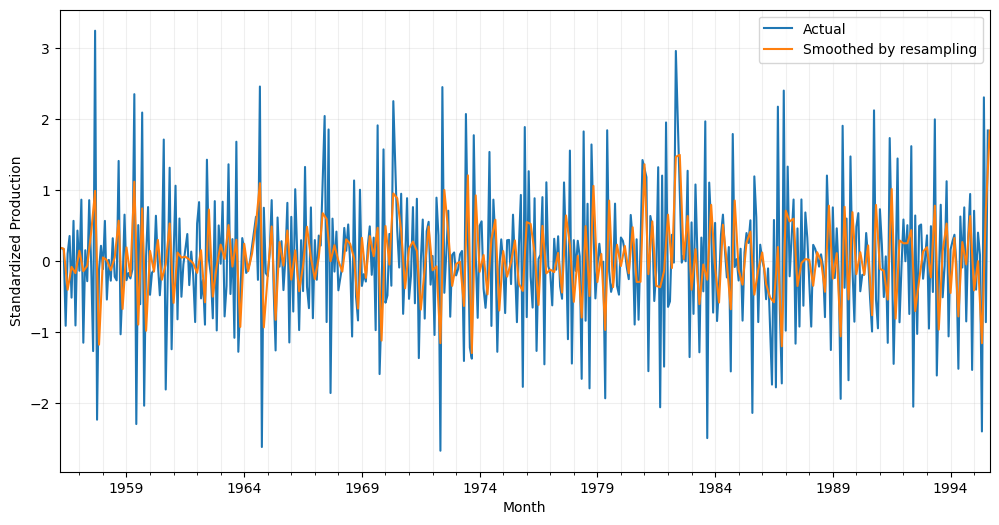
Spline interpolation
Spline interpolation is a popular smoothing technique for time series data that involves fitting a piecewise polynomial curve to the data points. This method can be particularly useful for time series data that exhibit complex and non-linear patterns, such as seasonal or cyclical fluctuations.
The method involves dividing the data into smaller segments and fitting a polynomial curve to each segment. For time series data, it is common practice to downsample the data before fitting the spline.
The resulting curve is then smoothed to ensure that it is continuous and differentiable, meaning that there are no abrupt changes or discontinuities. Spline interpolation is a powerful technique for time series data smoothing, but it is important to note that it can also introduce biases and distortions if not used appropriately. Therefore, it is essential to choose the appropriate spline order (k), segment length or frequency for the specific dataset and research question.
from scipy.interpolate import make_interp_spline

# Generate a smoothed curve using spline interpolation
x_smooth = pd.date_range(df_beer.index.min(),
                         df_beer.index.max(),
                         freq='2M')

y_smooth = make_interp_spline(df_beer.index,
                              df_beer['Production'],
                              k=3)(x_smooth)

# Create a new DataFrame with the smoothed data
df_smoothed = pd.DataFrame({'Month': x_smooth, 'Production': y_smooth})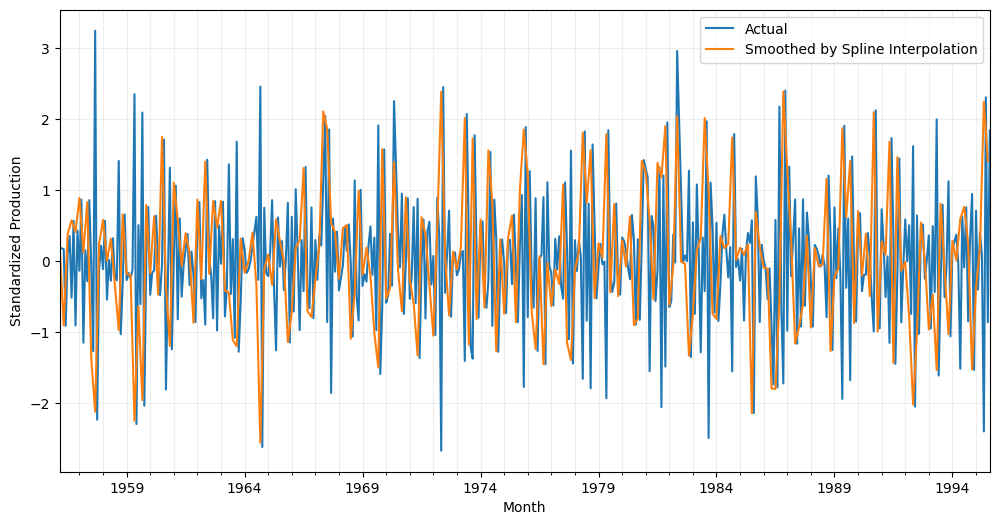
In conclusion, cleaning time series data is an important step in preparing it for analysis. Smoothing the data can help to reveal underlying patterns and trends that might otherwise be obscured by noise and other artifacts. However, it’s important to consider the potential impact of data smoothing on the analysis of the data.
See all the parts of the data cleaning series:
Our data is ready! Time to create a model!
You can access the notebook in our repository:

To run it right now click on the icon below:


0 Comments