In the context of time series analysis, a time series is said to be stationary if its statistical properties such as mean, variance, and autocorrelation, remain constant over time. This means that no matter at what point in time you observe the series, the properties are the same.
There are two main types of stationarity:
- Strict Stationarity: A stochastic process is called strictly stationary if, for all time points and any time shift, the joint distributions of the process are invariant under time shifts. In other words, the statistical properties of the process do not change even when shifted in time.
- Weak Stationarity (or Wide-sense stationarity): This is a less strict condition where only the mean and variance need to be constant over time, and the covariance between two time periods depends only on the lag between the two time periods and not the actual time at which the covariance is computed.
Stationarity is a fundamental assumption in many time series models, and it allows us to use powerful statistical techniques and models that rely on this property. Strict stationarity is a much stronger condition than weak stationarity and is often too strict for most practical applications. It’s also more difficult to test for strict stationarity using standard statistical methods. Therefore, we will always refer to weak stationarity when mentioning stationarity.
Following is an example of stationary and non-stationary time series data:
There are several ways to check if a time series is stationary:
- Visual Inspection: You can plot the time series and look for trends or seasonality. A stationary time series will not exhibit any visible trends or seasonality.
- Summary Statistics: You can split the time series into different partitions and compare the mean and variance of each group. If the mean and variance are similar across all groups, the series may be stationary.
- Statistical Tests: There are statistical tests designed to check for stationarity. Two of the most common ones are the Augmented Dickey-Fuller (ADF) test and the Kwiatkowski-Phillips-Schmidt-Shin (KPSS) test.
- The ADF test checks for a unit root in the series. If the test statistic is less than the critical value, we reject the null hypothesis (that the time series has a unit root) and infer that the time series is stationary.
- The KPSS test, on the other hand, tests for stationarity under the null hypothesis. If the test statistic is greater than the critical value, we reject the null hypothesis (that the time series is stationary) and infer that the time series is not stationary.
- Check Autocorrelation Function (ACF): You can use the autocorrelation function to determine if your data is stationary. If the data is stationary, the ACF should decay rapidly and your plot should lie within the 95% limits imposed.
Let’s see them one by one in more detail:
Visual inspection
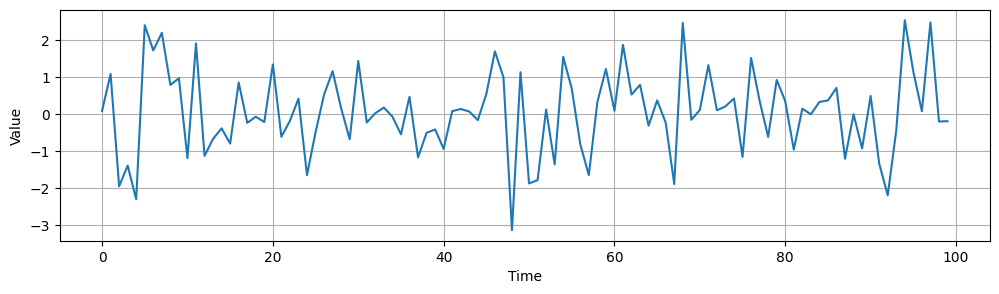
You can visually inspect this plot for trends or seasonality. If the plot shows a consistent mean and variance over time (i.e., the plot does not show any visible upward or downward trends, and the distance between the highest and lowest points remains approximately constant), then the time series may be stationary.
Here is an example of this. You can see that the time series data doesn’t show any trend and is around a mean of 0. Also, it varies around 2 and -2, so it seems to have a constant variance. Finally, you cannot see any clear patterns that may indicate seasonality.
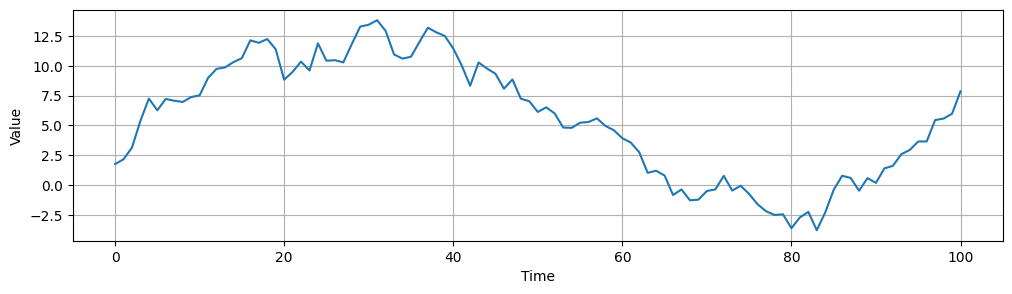
On the contrary, the following graph has a clear trend and its variance varies greatly across all periods.
Remember, visual inspection is subjective and should ideally be used in conjunction with other methods to confirm stationarity. It’s also worth noting that even if a series appears to be stationary through visual inspection, it may not necessarily be so. Always confirm with statistical tests.
Summary Statistics
Another useful and straightforward method is by looking at the summary statistics. You can split your time series into two (or more) partitions and compare the mean and variance of each group. The time series is likely non-stationary if they differ and the difference is statistically significant. You could also use the ANOVA test to check if the differences between partitions are significantly different or not. Here is an example checking the previously introduced stationary and non-stationary data:
from scipy import stats

def check_stationarity(series, n, alpha=0.05):
    partitions = np.array_split(series, n)
    for i, part in enumerate(partitions):
        print(f'Partition {i+1}: mean={part.mean()}, variance={part.var()}')

    # Perform ANOVA
    f_val, p_val = stats.f_oneway(*partitions)
    print(f'F-value: {f_val}, p-value: {p_val}')

    if p_val <= alpha:
        print('Partitions are significantly different --> Non-Stationary')
    else:
        print('Partitions are not significantly different --> Stationary')

# Partition data and check summary statistics
print('Stationary data')
check_stationarity(y_stationary, n=5)

print('Non-stationary data')
check_stationarity(y_non_stationary, n=5)
Stationary data
Partition 1: mean=0.08981068643586912, variance=1.7823929115428379
Partition 2: mean=-0.03595785139431832, variance=0.5947927907222066
Partition 3: mean=-0.15214933227431954, variance=1.6089350977009673
Partition 4: mean=0.34220296062071787, variance=0.956772987724178
Partition 5: mean=0.06414365855532422, variance=1.2548649168493458
F-value: 0.5163532467179542, p-value: 0.7238713173385095
Partitions are not significantly different --> Stationary
Non-stationary data
Partition 1: mean=8.00937483299316, variance=9.16338358440317
Partition 2: mean=11.60250464670637, variance=1.7257206923885071
Partition 3: mean=6.841717833304567, variance=3.8920932949997358
Partition 4: mean=-0.39918486113449564, variance=2.927681118436106
Partition 5: mean=1.552345894029977, variance=9.534423777004221
F-value: 83.19522396011787, p-value: 2.4231876290446545e-30
Partitions are significantly different --> Non-Stationary
Indeed, this test yields the expected result. However, there are more suitable tests for finding out whether our data is stationary or not.
Statistical Tests
The two most common statistical tests to find out whether the time series data is stationary or not are the Augmented Dickey-Fuller (ADF) test and the Kwiatkowski-Phillips-Schmidt-Shin (KPSS) test.
Augmented Dickey-Fuller test
The Augmented Dickey–Fuller (ADF) test is employed to assess the presence of a unit root, which indicates non-stationarity in a time series.
The null hypothesis asserts the existence of a unit root, while the alternative hypothesis proposes stationarity. The ADF test relies on the p-value to ascertain the stationarity of the series. If the p-value falls below the significance level, commonly set at 0.05, the null hypothesis is rejected, leading to the conclusion of stationarity. Conversely, if the p-value exceeds the significance level, the series is deemed non-stationary.
In Python you can use the following code to check if your data is stationary according to the ADF test:
from statsmodels.tsa.stattools import adfuller
adf_result = adfuller(time_series)
print(f'ADF Statistic: {adf_result[0]}')
print(f'p-value: {adf_result[1]}')
Kwiatkowski-Phillips-Schmidt-Shin test
The Kwiatkowski–Phillips–Schmidt–Shin (KPSS) test is designed to evaluate the stationarity of a time series by examining its trend and seasonality components.
In this test, the null hypothesis assumes stationarity, while the alternative hypothesis suggests non-stationarity. Rejecting the null hypothesis in the context of the KPSS test signifies the presence of non-stationarity. Specifically, if the p-value is below the significance level, stationarity is rejected. Conversely, if the p-value exceeds the significance level, typically set at 0.05, we refrain from rejecting stationarity, and therefore we can assume that our data is stationary.
You can test if your data meets the KPSS test criteria for stationarity with this Python code:
from statsmodels.tsa.stattools import kpss_result
kpss_result = kpss(y, regression='c')
print(f'KPSS Statistic: {kpss_result[0]}')
print(f'p-value: {kpss_result[1]}'
Combining the ADF and KPSS tests provides insights into a time series’ stationarity. If both tests indicate stationarity, we can proceed with forecasting. If either test suggests non-stationarity, further analysis or transformations may be needed.
Check Autocorrelation Function
Autocorrelation Function (ACF) and Partial Autocorrelation Function (PACF) are two powerful tools used in time series analysis. Here’s how you can use them to determine if a dataset is stationary:
- Autocorrelation Function (ACF): it is a statistical tool used in time series analysis to measure the correlation between a time series and its own past values at different time lags.
- Partial Autocorrelation Function (PACF): it is a statistical measure used in time series analysis to identify the direct relationship between an observation and its lag, while accounting for the relationships with the intermediate lags. In simpler terms, PACF helps to isolate the direct correlation between a data point and its specific lag, excluding the influence of other lags.
To check for stationarity we will use the ACF:
- Plot the ACF of your time series data. Each bar represents the size and direction of the correlation for each lag.
- If the series is stationary, the ACF will drop to zero relatively quickly, typically with a sharp cut-off point.
- If the series is non-stationary, the ACF will decay slowly.
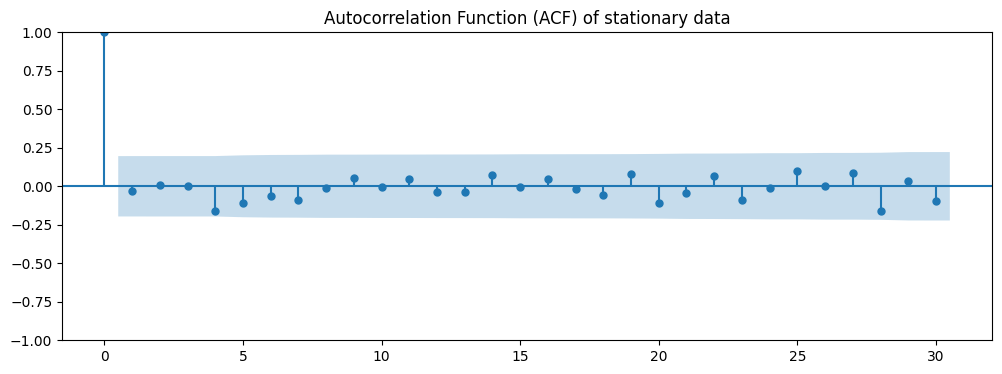
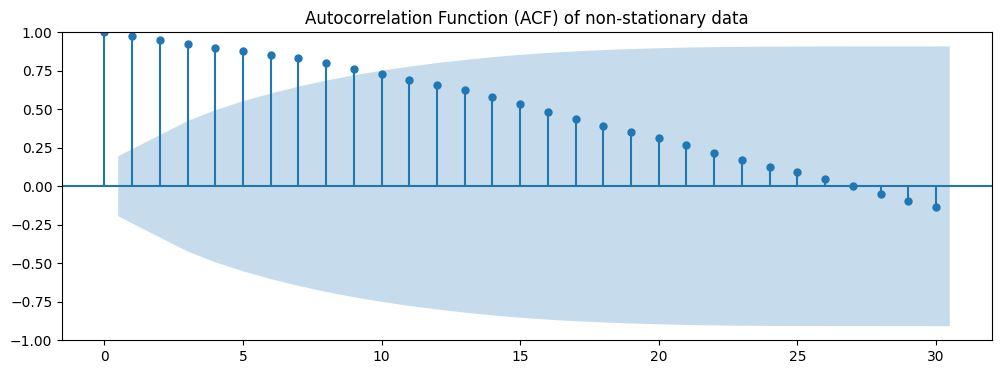
You can start by plotting the ACF of your time series. On the x-axis, you have the lag, and on the y-axis, you have the value of the autocorrelation. Each bar represents the size and direction of the correlation for each lag.
Generally, the best method is using statistical tests. But the other methods can help you verify the results yielded by the ADF and KPSS tests.


0 Comments