Machine learning models often operate in complex data environments where understanding the contribution of each feature to the model’s predictions is crucial. Determining feature importance is a key aspect of model interpretation, enabling us to grasp which factors significantly influence the model’s output. Let’s now explore different methods to determine the feature importance of our models.
Linear Models
Linear models, such as Linear Regression, assume a linear relationship between input features and the target variable. The coefficients assigned to each feature reveal their individual impact on the model’s predictions. However, it’s important to note that the interpretation of these coefficients is straightforward only when the features are independent. In cases where features are correlated, the interpretation of coefficients can be misleading as they may not reflect the true impact of each feature on the prediction. Therefore, when using linear models, it’s crucial to check for multicollinearity among the features to ensure an accurate interpretation of the coefficients.
from sklearn.linear_model import LinearRegression

model = LinearRegression()
model.fit(X_train, y_train)

feature_importance = model.coef_
The magnitude of coefficients matters—the larger the absolute value, the more significant the impact. Positive coefficients indicate a positive influence on the target variable, while negative coefficients imply a negative effect.
Tree-Based Models
Decision trees, Random Forests, and Gradient Boosted Trees base their predictions on recursive binary splits of the data. Feature importance in these models is assessed by the contribution of each feature to reducing impurity or error during the decision-making process. However, it’s worth noting that feature importance in tree-based models can sometimes be biased towards features with more levels or categories. This is because these features have more opportunities to split the data and reduce impurity, which might give an inflated sense of their importance. Therefore, when interpreting feature importance from tree-based models, it’s crucial to consider this potential bias.
from sklearn.ensemble import RandomForestRegressor

model = RandomForestRegressor()
model.fit(X_train, y_train)

feature_importance = model.feature_importances_
The feature_importances_ attribute provides a normalized score for each feature. Features with higher importance contribute more to the model’s decision-making.
Permutation Importance
Permutation importance is a model-agnostic method that computes feature importance for any model by shuffling the values of each feature one at a time and measuring the resulting change in model performance. The process works by breaking the relationship between each feature and the target variable, then observing the impact on the model’s performance. A higher decrease in performance upon shuffling indicates greater feature importance.
However, it’s worth noting that permutation importance can be computationally expensive for large datasets or complex models, as it requires re-evaluating the model performance after shuffling each feature. Despite this, it’s a valuable tool for understanding feature importance, especially when working with models where traditional feature importance measures are not easily accessible or interpretable. It provides a ranking of features based on their contribution to the model’s predictive performance on unseen data, making it a powerful tool for model interpretability.
from sklearn.inspection import permutation_importance

# Assume model is your trained model
perm_importance = permutation_importance(model, X_test, y_test, n_repeats=30, random_state=42)

feature_importance = perm_importance.importances_mean
Permutation importance offers insights into feature importance without relying on specific model characteristics.
SHAP
SHAP (SHapley Additive exPlanations) values, rooted in cooperative game theory, offer a unified measure of feature importance that allocates the contribution of each feature to the prediction for every possible combination of features. This method ensures a fair distribution of contributions, as it respects both efficiency and symmetry among features.
In essence, SHAP values answer the question: “how much does each feature contribute to the prediction, considering all possible combinations of features?” They are particularly useful for understanding the impact of each feature on individual predictions, providing a more granular view of feature importance that can reveal complex patterns in your data.
However, it’s worth noting that calculating SHAP values can be computationally intensive, especially for models with a large number of features or complex interactions. Despite this, they offer a powerful tool for interpretability, especially when you need to explain individual predictions in addition to understanding overall feature importance.
import shap
from sklearn.ensemble import RandomForestRegressor

model = RandomForestRegressor()
model.fit(X_train, y_train)

explainer = shap.TreeExplainer(model)
shap_values = explainer.shap_values(X_test)

shap.summary_plot(shap_values, X_test)
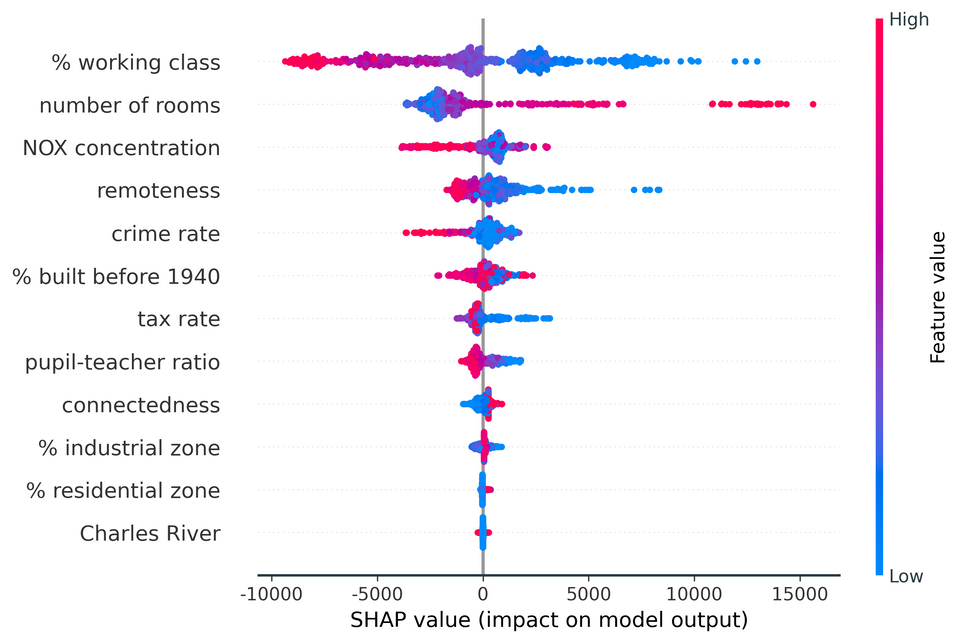
Positive SHAP values indicate a feature pushing the model’s prediction higher, while negative values suggest the feature is pushing the prediction lower. The magnitude of the SHAP value shows the strength of this push. This allows for a more nuanced understanding of feature importance that takes into account both the direction and magnitude of a feature’s effect on the model’s predictions.
Recursive Feature Elimination (RFE)
Recursive Feature Elimination (RFE) is an iterative method used for feature selection in machine learning. The goal of feature selection is to identify and remove unnecessary features from the data that do not contribute, or may even decrease, the predictive performance of the model. RFE achieves this by recursively fitting the model, ranking the features based on their impact on model performance, and removing the least important feature at each step. This process continues until all features have been evaluated and ranked.
However, it’s worth noting that RFE can be computationally expensive for models with a large number of features, as it involves repeatedly fitting the model and evaluating its performance. Despite this, RFE is a valuable tool for feature selection, especially when you need to reduce the dimensionality of your data or improve model interpretability.
from sklearn.feature_selection import RFE
from sklearn.linear_model import LinearRegression

rfe = RFE(model, n_features_to_select=1)
fit = rfe.fit(X_train, y_train)

feature_ranking = fit.ranking_
RFE provides a ranked list of features, allowing us to focus on the most influential variables.
LASSO Regression
LASSO (Least Absolute Shrinkage and Selection Operator) is a linear regression technique that not only helps in reducing overfitting but also in feature selection. It introduces a penalty term to the loss function. During the learning process, this penalty term causes some of the model’s coefficients to shrink to exactly zero. This zeroing of coefficients effectively reduces the number of features in the final model, as features with non-zero coefficients are considered important while those with zero coefficients are deemed unimportant.
However, it’s worth noting that the degree of shrinkage is controlled by a hyperparameter, often denoted as λ (lambda). A larger λ results in more coefficients being shrunk to zero, leading to a simpler model with fewer features. Conversely, a smaller λ will result in a model with more features, as fewer coefficients are shrunk to zero. Therefore, selecting an appropriate value for λ is crucial for balancing model complexity and performance.
from sklearn.linear_model import Lasso

model = Lasso(alpha=0.01)
model.fit(X_train, y_train)

feature_importance = model.coef_
LASSO Regression is particularly useful when dealing with high-dimensional datasets, effectively performing feature selection.
Correlation Matrix
Analyzing the correlation matrix is a simple and effective method for preliminary feature selection and importance evaluation. It involves calculating the pairwise correlation of all variables in your dataset and using this as an indicator of how each feature is related to the target variable.
In essence, a correlation matrix provides a measure of the linear relationships between variables. Features that have a high absolute correlation with the target variable are often considered important, as they are likely to have a significant influence on the model’s predictions.
However, it’s important to note that correlation is a measure of linear association and may not capture non-linear relationships. Also, correlation does not imply causation. A high correlation between a feature and the target variable does not necessarily mean that the feature causes the target variable to change.
Despite these limitations, analyzing the correlation matrix can be a good starting point for feature selection, especially in the exploratory data analysis phase. It can help you understand your data better and inform your decisions about which features to include in your model.
import pandas as pd

correlation_matrix = df.corr()
target_correlation = correlation_matrix['target_variable'].abs().sort_values(ascending=False)
The correlation matrix is a quick way to identify potentially influential features.
In conclusion, understanding feature importance is a multifaceted process, and the choice of method depends on the characteristics of the data and the specific model being used. You should leverage a combination of these techniques to gain a proper understanding of your machine learning models.


0 Comments