Outliers are data points that significantly differ from the rest of the data in a dataset. They are observations that lie at an abnormal distance from other values in a random sample from a population. Identifying and handling outliers is crucial because they can skew results and impact the performance of statistical models.
Outliers can occur for various reasons, including:
- Data Entry Errors: Typos or mistakes during data entry can lead to outliers.
- Measurement Errors: Errors in the measurement process can result in values that do not accurately represent the true nature of the data.
- Genuine Extreme Values: Sometimes, outliers may represent legitimate extreme values in the data. It’s important to differentiate between genuine outliers and errors.
- Sampling Errors: Outliers can also arise due to issues with the sampling process, especially in small sample sizes.
- Data processing errors: Mistakes in data cleaning or data transformation can introduce outliers into the dataset.
- Natural variability: In some cases, outliers may be a result of natural variability in the data. Certain events or conditions can lead to extreme values that are outside the normal range.
Outliers in normally distributed data
Even in a normal distribution, there can be outliers. Depending on their nature and the sensitivity of your model to outliers, you might want to address them. Common strategies include truncation, or using statistical methods to cap or adjust these values.
The following first three methods help us identify them, while the fourth one will both identify and address them (which should actually be considered within the data cleaning stage instead of within the EDA one).
Z-Score or Standard Deviation Method
This method is commonly used for normally distributed data. It identifies outliers based on how many standard deviations a data point is from the mean. It assumes that the data follows a normal distribution.
from scipy.stats import zscore

# Calculate Z-scores for each column
z_scores = zscore(df)

# Set a threshold for considering values as outliers (e.g., ±3 standard deviations)
threshold = 3

# Identify outliers based on the threshold
outliers = (abs(z_scores) > threshold).any(axis=1)
Interquartile Range (IQR) Method
The IQR method is robust and effective for identifying outliers in normal distributions. It is less sensitive to extreme values and is suitable for symmetric distributions like the normal distribution.
# Calculate the first quartile (Q1) and third quartile (Q3) for each column
Q1 = df.quantile(0.25)
Q3 = df.quantile(0.75)

# Calculate the Interquartile Range (IQR) for each column
IQR = Q3 - Q1

# Set a threshold for considering values as outliers (e.g., 1.5 times IQR)
threshold = 1.5

# Identify outliers based on the threshold
outliers = ((df < (Q1 - threshold * IQR)) | (df > (Q3 + threshold * IQR))).any(axis=1)
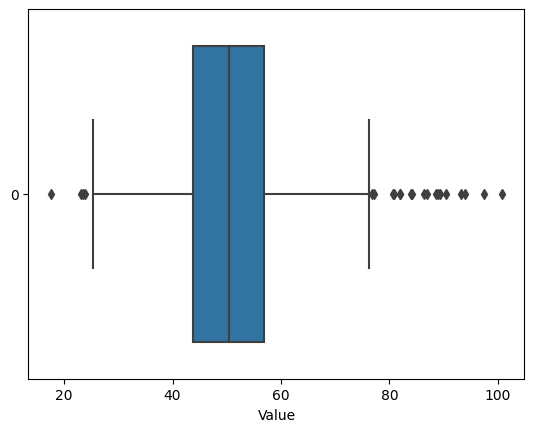
You can also visualize the outliers, which is related to the IQR method. Here how you can do it:
import seaborn as sns

# Create a horizontal boxplot using Seaborn
sns.boxplot(data=data, orient='h')
plt.xlabel('Value')
plt.show()
You can see that the outliers, if any, appear on both sides of the box plot, as individual dots. This could help you understand how your outliers compare to the rest of the data.
Model-Based Approaches
Model-based approaches, such as robust regression models, can be suitable for handling outliers in normally distributed data. These models are designed to be less sensitive to the influence of extreme values. One possibility is the RANSAC regressor:
from sklearn.linear_model import RANSACRegressor

# Instantiate a RANSACRegressor
ransac = RANSACRegressor()

# Fit the model to the data
ransac.fit(X, y)

# Identify inliers and outliers
inliers_mask = ransac.inlier_mask_
outliers_mask = ~inliers_mask
Winsorizing
Winsorizing is a method where extreme values are replaced with less extreme values. This approach is appropriate for normal distributions, especially when you want to mitigate the impact of outliers without completely removing them.
from scipy.stats.mstats import winsorize

# Set a percentage for winsorizing (e.g., 5% on each tail)
winsorizing_percentage = 0.05

# Winsorize the DataFrame
df_winsorized = df.apply(lambda x: winsorize(x,
                                             limits=(winsorizing_percentage, winsorizing_percentage)))
What to do with the outliers?
Once you’ve identified the outliers in your dataset, you have several options for how to handle them (it required). The appropriate approach depends on the nature of your data and the goals of your analysis. Here are some common strategies:
- Remove Outliers:
- The simplest approach is to remove the rows containing outliers from your dataset. This can be appropriate if the outliers are likely to be data errors or anomalies.
- Imputation:
- If the outliers are in the target variable (the variable you are trying to predict), you may choose to impute or replace them with a more typical value. This could be the mean, median, or a value predicted by a model.
- Transform or Winsorize:
- Instead of removing outliers, you can transform the data using mathematical functions (e.g., log transformation) or Winsorizing to limit the impact of extreme values.
- Separate Analysis:
- Conduct separate analyses for the data with and without outliers. This allows you to understand how much influence the outliers have on your results.
- Model-Based Approaches:
- Use robust regression models that are less sensitive to outliers. This allows you to still include the outlier-affected data points in your analysis.
- Domain-Specific Treatment:
- Consider the domain and context of your data. In some cases, outliers may be meaningful and represent rare but valid events. Consult with domain experts to determine the appropriate handling strategy.
- Flagging:
- Instead of removing outliers, you can flag them by creating an additional variable or column to indicate whether a data point is an outlier. This way, you retain the information but allow for differential treatment in your analysis.
- Data Partitioning:
- Partition your dataset into two sets: one with outliers and one without. Analyze each subset separately or combine the results as needed.


0 Comments