Part III: Exogenous variables
In the previous part of our Facebook Prophet series, we covered how to model the seasonality component. You should also recall the first part, in which we dealt with trend modelling.
In this article, we’ll focus on how we can add exogenous variables to our model. They are also known as independent variables or predictor variables. They are variables that are not directly influenced by other variables within a system or model. In other words, variables that are assumed to have a causal effect on other variables in the system, but are not affected by them. Exogenous variables are typically introduced into a model to explain or predict the behaviour of an endogenous variable, which is a variable that is influenced by other variables in the model.
In Facebook Prophet, we can distinguish three types: holidays, special events and regressors.
Holidays
Facebook Prophet makes it really easy to take into consideration country-specific holidays in the model. You can do this with the add_country_holidays method. In this code we will add the United Kingdom holidays:
# Import libraries
import pandas as pd
from prophet import Prophet

# Load data
df = pd.read_csv('dataset.csv')

# Instantiate model, add holidays and fit data
model = Prophet()
model.add_country_holidays(country_name='UK')
model.fit(df)

# Define forecasting period
future = model.make_future_dataframe(periods=72,
                                     freq='H')

# Predict future values
forecast = model.predict(future)
We can now plot the components to visualize it:
fig = model.plot_components(forecast)
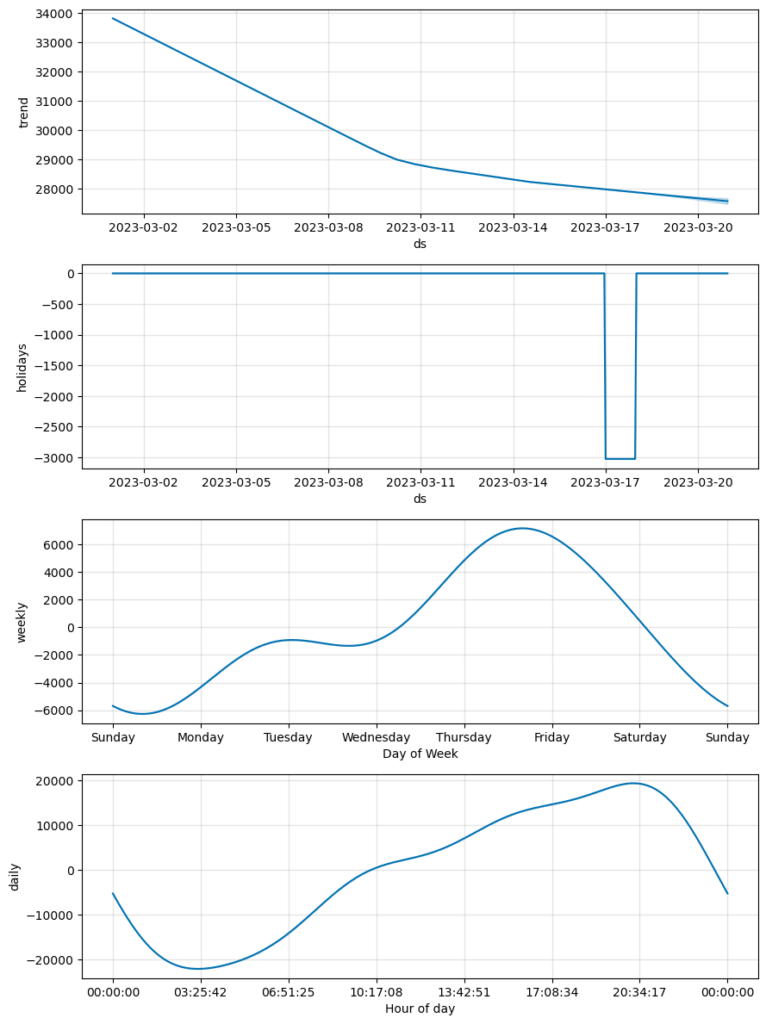
You can see that there was a holiday on the 17th of March, which corresponds to St Patrick’s Day.
You can also have a look at which holidays is Prophet including:
model.train_holiday_names0 Coronation of Charles III
1 New Year's Day
2 New Year Holiday [Scotland]
3 New Year's Day (Observed)
4 New Year Holiday [Scotland] (Observed)
5 St. Patrick's Day [Northern Ireland]
6 Battle of the Boyne [Northern Ireland]
7 Summer Bank Holiday [Scotland]
8 St. Andrew's Day [Scotland]
9 Christmas Day
10 Good Friday
11 Easter Monday [England/Wales/Northern Ireland]
12 May Day
13 Spring Bank Holiday
14 Late Summer Bank Holiday [England/Wales/Northe...
15 Boxing Day
dtype: object
You can see which countries can be added and the country name to use in this link.
Stay up-to-date with our latest articles!
Subscribe to our free newsletter by entering your email address below.
Special events
There may be cases in which you would want to add some additional or special events.
We need to specify the dates, the name of the special event (or holiday) and the lower and upper windows:
lower_window: this refers to the starting reference point. To selectively include specific days in the model, we can adjust it. Setting it to zero would consider only the current day. If we want to incorporate the day before the event, we can set it to -1. Similarly, by setting it to -2, -3, and so on, we can include multiple preceding days.upper_window: similarly, this refers to the ending reference point. We can set it to 0 if we only want to consider up to that date. Otherwise, by setting it to 1, 2, 3, and so on, we can include multiple following days.
For example, in this particular case, there were two days of programmed maintenance on the system: the 5th of March and the 15th of March of 2023. We want only to model the days of maintenance, so we will set both the lower and upper windows to zero.
maintenance = pd.DataFrame({
  'holiday': 'maintenance',
  'ds': pd.to_datetime(['2023-03-05', '2023-03-15']),
  'lower_window': 0,
  'upper_window': 0,
})
In addition to that, there was a relevant marketing event for 3 days on the 8th of March. In this case, we need to set the upper window to 2, so it considers two additional days to the starting date.
marketing = pd.DataFrame({
  'holiday': 'marketing',
  'ds': pd.to_datetime(['2023-03-08']),
  'lower_window': 0,
  'upper_window': 2,
})
We can consider them by concatenating both dataframes. Prophet calls these special events “holidays”, therefore we will refer to them as so:
holidays = pd.concat((maintenance, marketing))
We can now build the model (we will skip the country holidays here) and plot the components:
# Instantiate model, add events and fit data
model = Prophet(holidays=holidays)
model.fit(df)

# Define forecasting period
future = model.make_future_dataframe(periods=72,
                                     freq='H')

# Predict future values
forecast = model.predict(future)

# Plot components
fig = model.plot_components(forecast)
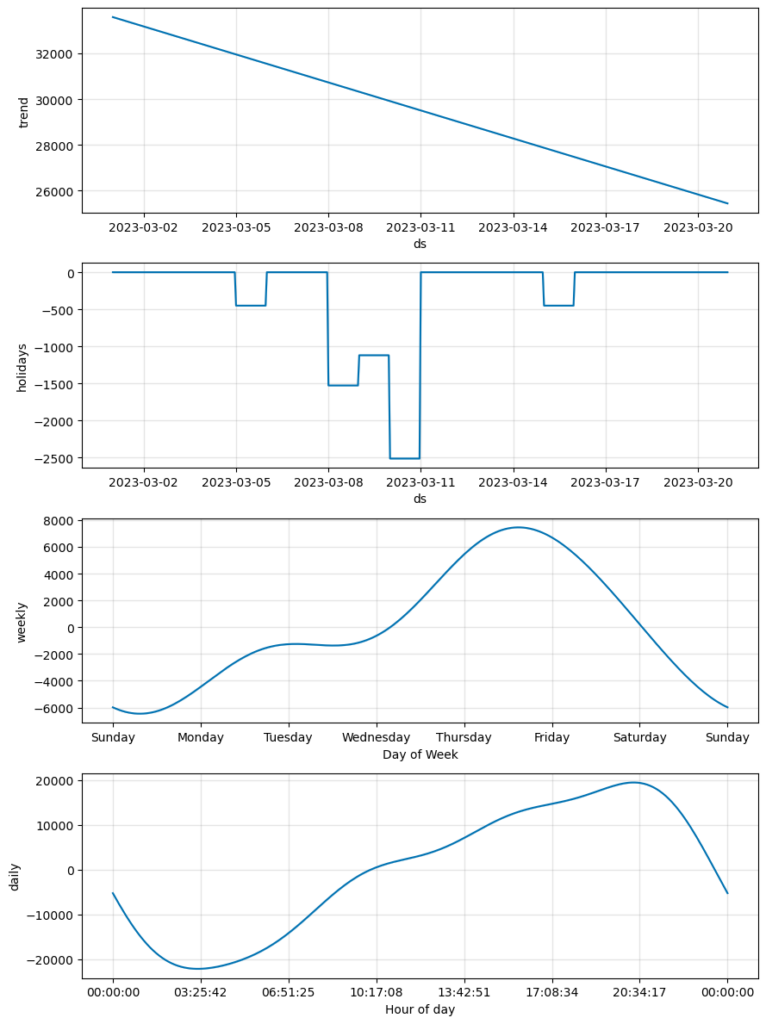
We can see how they are taken into consideration in the model.
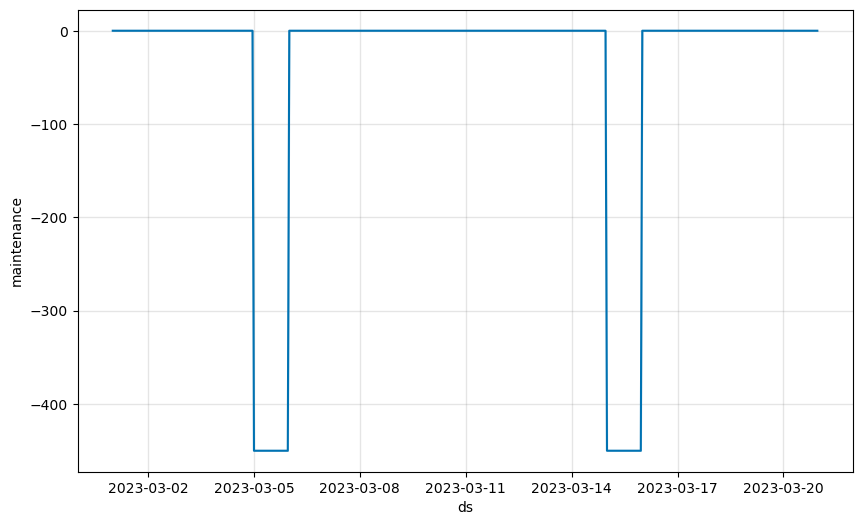
We can also plot only one of the special events as follows:
from prophet.plot import plot_forecast_component
plot_forecast_component(model, forecast, 'maintenance')
plt.show()
Add regularization
Similarly to what we did for the seasonality components, we can also add regularization to the holidays and special events if we think they are overfitting. By reducing the holidays_prior_scale parameter (set to 10 by default) we can dampen their effect.
# Instantiate model, add events and fit data
model = Prophet(holidays=holidays,
                holidays_prior_scale=0.01)
model.fit(df)

# Define forecasting period
future = model.make_future_dataframe(periods=72,
                                     freq='H')

# Predict future values
forecast = model.predict(future)

# Plot components
fig = model.plot_components(forecast)
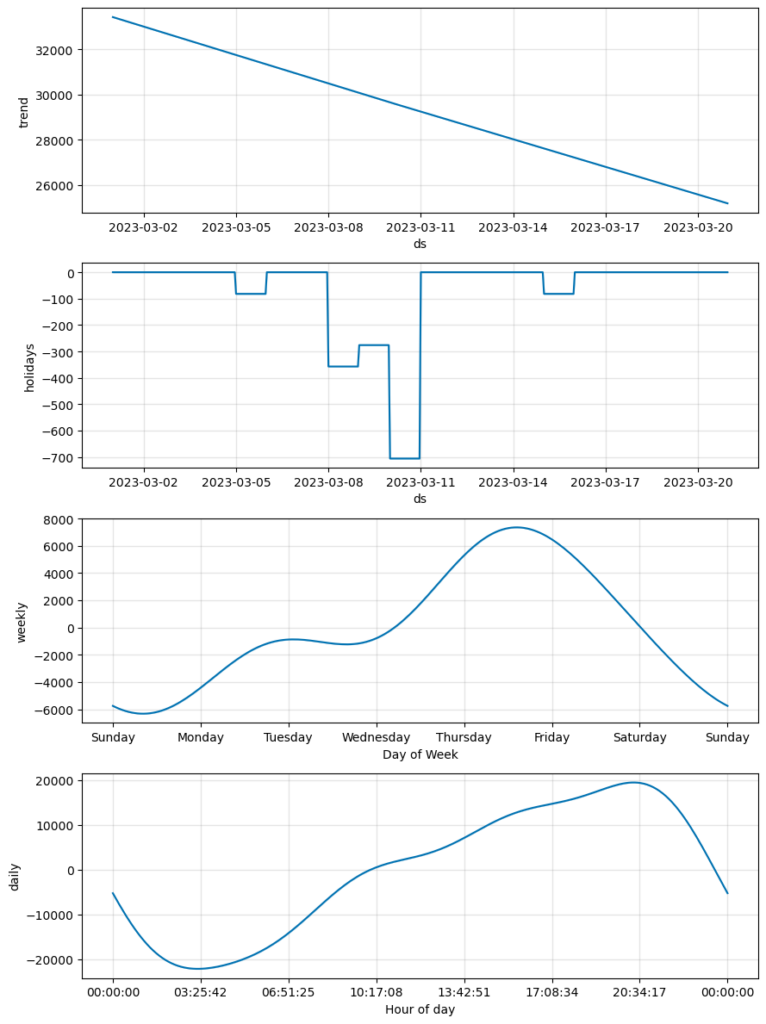
Regressors
Regressors can also be utilized to incorporate the effects of holidays and special events. One of their notable benefits is that they offer a more general interface for defining additional linear regressors, without the necessity for the regressor to be strictly a binary indicator. So this opens the possibility of using another time series as a regressor, however, these values must be known for the period of the forecast.
For example, we can add a binary regressor that indicates whether the day is a weekend or not, and a continuous one indicating the hourly temperature that day.
For the first one, the weekend regressor, we can do the following:
# Define function to determine if the day is a weekend
def weekend(ds):
    date = pd.to_datetime(ds)
    if date.weekday() >= 5:
        return 1
    else:
        return 0

# Apply the function to the dataset
df['weekend'] = df['ds'].apply(weekend)
For the second case, the hourly temperature, we need to use an API or external data to find the values. Since we need to know the values in the period of forecast, we will need to get the future values from some weather forecast API. In this case, for simplicity, we will consider data from the past, as we already know the temperatures of those days.
We can use the meteostat Python library to get the historic temperatures in a location, in our case in London.
# Install library
!pip install meteostat

# Import Meteostat library and dependencies
import datetime
from meteostat import Point, Hourly

# Set time period
start = datetime.datetime(2023, 3, 1)
end = datetime.datetime(2023, 3, 31)

# Create Point for London
location = Point(51.509865, -0.11809, 7.971)

# Get daily data for March 2023
data = Hourly(location, start, end)
data = data.fetch()

# Extract temperature from data
temp = data[['temp']]

# Add it to Prophet dataframe
df = df.merge(temp, left_on='ds', right_index=True)
The dataframe to be input to the model will look like this:
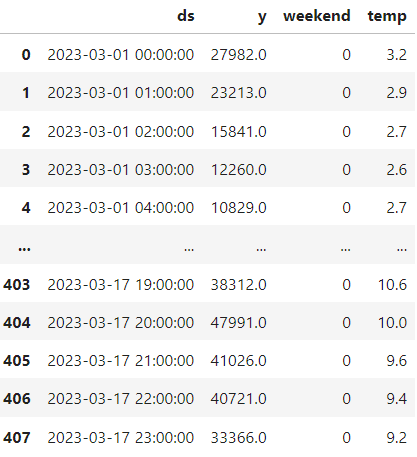
Remember that we need to know the values for the period of forecast. That’s the reason why we need to also add “weekend” and “temp” to future as we did with df:
# Instantiate model and fit data
model = Prophet()
model.fit(df)

# Define forecasting period
future = model.make_future_dataframe(periods=72,
                                     freq='H')

# Add regressors to future dataframe
future['weekend'] = future['ds'].apply(weekend)
future = future.merge(temp, left_on='ds', right_index=True)

# Predict future values
forecast = model.predict(future)

# Plot components
fig = model.plot_components(forecast)
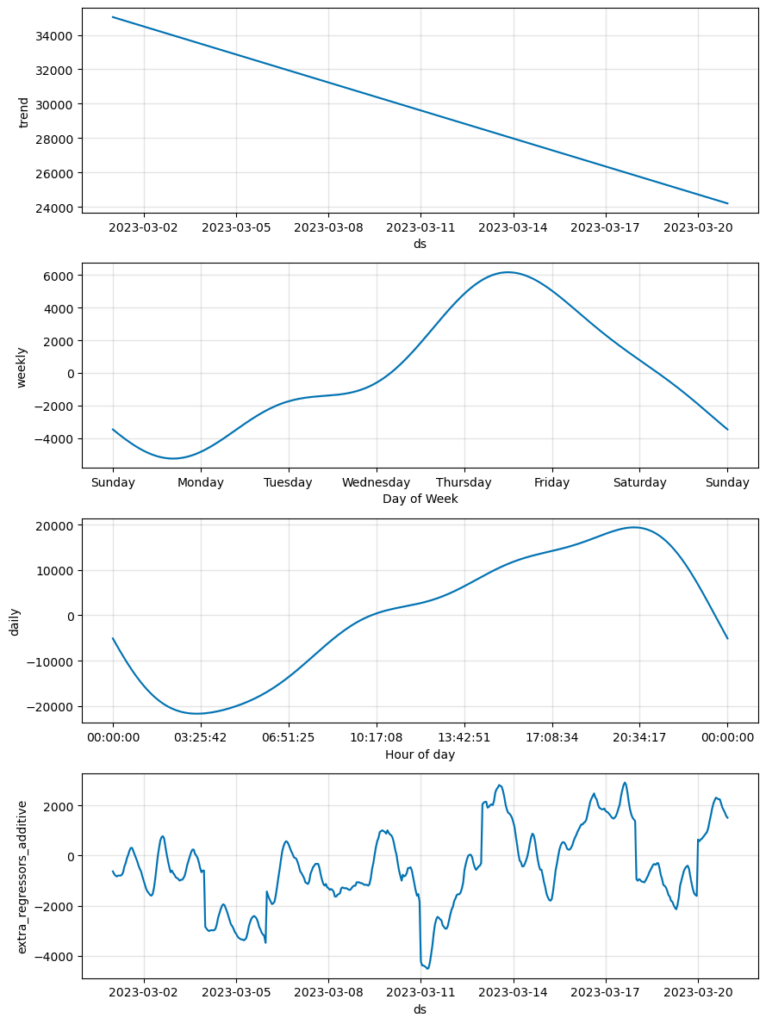
We can see the effect of the additional regressors in the previous graph. If we want to see each of the regressor’s effects separately we can do the following:
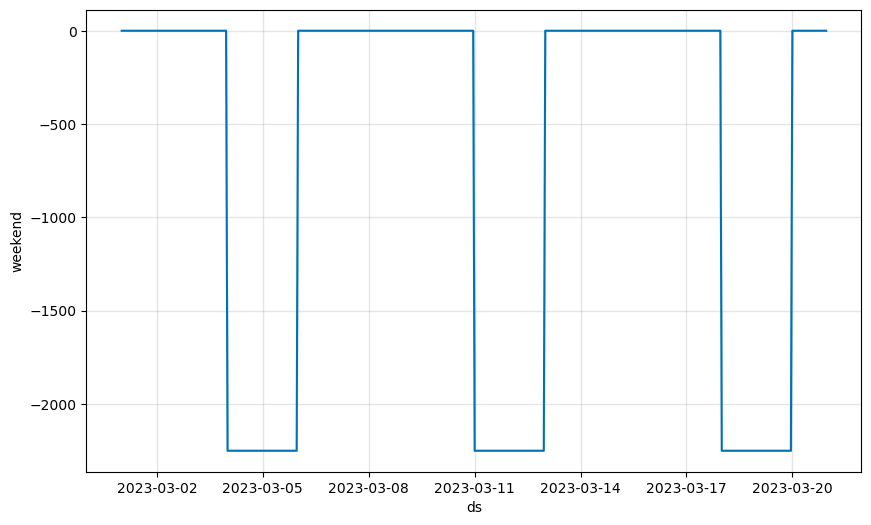
from prophet.plot import plot_forecast_component
# Plot weekend component
plot_forecast_component(model, forecast, 'weekend')
plt.show()
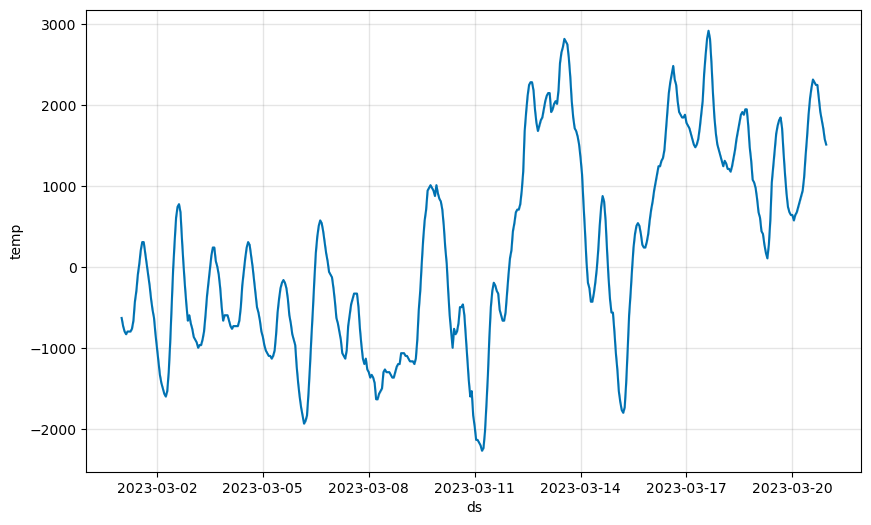
# Plot temperature component
plot_forecast_component(model, forecast, 'temp')
plt.show()
Finally, remember that Facebook Prophet by default models everything as an additive component. If you want to model this as multiplicative, you can do the following with each regressor. Also, you can modify the prior scale to dampen its effect.
model.add_regressor('weekend',
                    prior_scale=0.05,
                    mode='multiplicative'
                    )
In conclusion, as demonstrated in this article and the preceding two, Prophet stands out as an exceptional tool offering a wide range of powerful features for users to efficiently model their data and generate precise forecasts. By leveraging the advanced capabilities provided by Prophet, users can significantly enhance their data analysis process, effortlessly predict future outcomes, and gain invaluable insights to drive informed decision-making.
Time Series Forecasting with Facebook Prophet:


0 Comments